
Understanding Cash Flow Ratios for Financial Analysis
CFA FRM Financial Analysis
I. Introduction
Cash flow ratios are essential tools for financial analysis that provide insights into a company’s ability to generate cash, manage liquidity, and create value for shareholders. Unlike traditional accounting ratios that rely on accrual-based earnings, cash flow ratios focus on actual cash movements, offering a more accurate picture of financial health and operational efficiency.
This comprehensive guide covers the most important cash flow ratios used by analysts, investors, and financial professionals, including Free Cash Flow to the Firm (FCFF), Free Cash Flow to Equity (FCFE), and various performance ratios that measure cash generation efficiency.
II. Understanding Cash Flow Components
Before diving into specific ratios, it’s crucial to understand the fundamental cash flow components:
Operating Cash Flow (CFO): Cash generated from core business operations, representing the company’s ability to generate cash from its primary activities.
Investing Cash Flow (CFI): Cash flows related to investments in assets, acquisitions, and disposals of long-term assets.
Financing Cash Flow (CFF): Cash flows from financing activities, including debt issuance, equity transactions, and dividend payments.
Net Income: The company’s profit after all expenses, taxes, and costs have been deducted.
Non-Cash Charges: Expenses that don’t involve actual cash outflows, such as depreciation and amortization.
III. Using Our Cash Flow Calculator Tools
Access Online Calculators: Visit our comprehensive Cash Flow Statement Calculator to calculate these ratios efficiently:
- FCFF Calculator
- FCFE Calculator
- Cash-to-Income Ratio Calculator
- Cash Flow to Revenue Calculator
- Cash Return on Assets Calculator
- Cash Return on Equity Calculator
- Cash Flow per Share Calculator
IV. Free Cash Flow Ratios
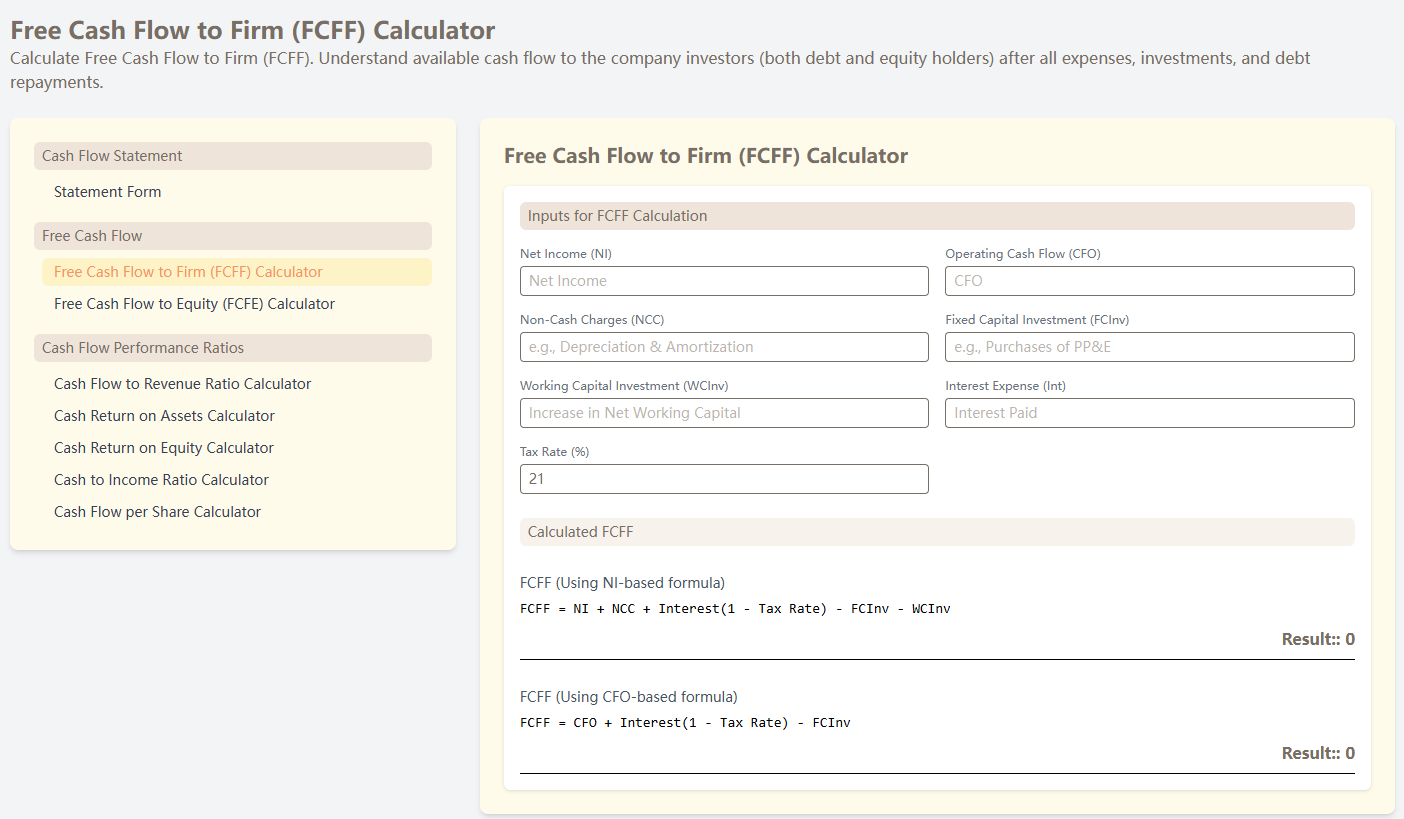
Free Cash Flow to the Firm (FCFF)
FCFF represents the cash flow available to all investors (both debt and equity holders) after the company has met its operating expenses and necessary capital expenditures.
Formula (Net Income Based):
FCFF = Net Income + Non-Cash Charges + Interest × (1 - Tax Rate) - Fixed Capital Investment - Working Capital Investment
Formula (CFO Based):
FCFF = Operating Cash Flow + Interest × (1 - Tax Rate) - Fixed Capital Investment
Interpretation:
- Positive FCFF indicates the company generates sufficient cash to meet all obligations
- Higher FCFF suggests better financial flexibility and growth potential
- Used in DCF valuation models to determine enterprise value
Free Cash Flow to Equity (FCFE)
FCFE represents the cash flow available specifically to equity shareholders after all expenses, taxes, debt payments, and necessary investments.
Formula (Net Income Based):
FCFE = Net Income + Non-Cash Charges - Fixed Capital Investment - Working Capital Investment + Net Borrowing
Formula (CFO Based):
FCFE = Operating Cash Flow - Fixed Capital Investment + Net Borrowing
Interpretation:
- Positive FCFE indicates cash available for dividend payments or share buybacks
- Higher FCFE suggests greater potential for shareholder returns
- Used to value equity directly in DCF models
V. Cash Flow Performance Ratios
Cash-to-Income Ratio
This ratio measures how effectively a company converts its reported earnings into actual cash flow.
Formula:
Cash-to-Income Ratio = Operating Cash Flow ÷ Net Income
Interpretation:
- Ratio > 1.0: Company generates more cash than reported earnings (positive sign)
- Ratio < 1.0: May indicate earnings quality issues or high working capital requirements
- Consistent ratios above 1.0 suggest high-quality earnings
Cash Flow to Revenue Ratio
This ratio evaluates a company’s ability to convert sales into cash flow.
Formula:
Cash Flow to Revenue Ratio = Operating Cash Flow ÷ Total Revenue
Interpretation:
- Higher ratios indicate efficient cash collection and cost management
- Industry comparison is crucial as ratios vary significantly across sectors
- Declining ratios may signal operational challenges
Cash Return on Assets (CROA)
CROA measures how efficiently a company uses its assets to generate cash flow.
Formula:
CROA = Operating Cash Flow ÷ Total Assets
Interpretation:
- Higher ratios indicate more efficient asset utilization
- Useful for comparing companies within the same industry
- Provides insight into management’s effectiveness in deploying assets
Cash Return on Equity (CROE)
CROE evaluates how effectively a company uses shareholders’ equity to generate cash flow.
Formula:
CROE = Operating Cash Flow ÷ Total Equity
Interpretation:
- Higher ratios suggest better returns for equity investors
- Should be compared with traditional ROE for comprehensive analysis
- Indicates the cash-generating power of shareholder investments
Cash Flow per Share (CFPS)
CFPS measures the cash flow generated per outstanding share, providing a per-share perspective on cash generation.
Formula:
CFPS = Operating Cash Flow ÷ Shares Outstanding
Interpretation:
- Higher CFPS indicates stronger cash generation per share
- Often compared with earnings per share (EPS) for quality assessment
- Useful for valuation and dividend sustainability analysis
VI. Practical Example: Comprehensive Cash Flow Analysis
Let’s analyze a company with the following financial data:
- Operating Cash Flow: $500,000
- Net Income: $400,000
- Total Revenue: $2,000,000
- Total Assets: $5,000,000
- Total Equity: $3,000,000
- Shares Outstanding: 100,000
- Fixed Capital Investment: $200,000
- Working Capital Investment: $50,000
- Interest Expense: $30,000
- Tax Rate: 25%
Step 1: Calculate FCFF
FCFF = $500,000 + ($30,000 × (1 - 0.25)) - $200,000
FCFF = $500,000 + $22,500 - $200,000 = $322,500
Step 2: Calculate Performance Ratios
Cash-to-Income Ratio = $500,000 ÷ $400,000 = 1.25
Cash Flow to Revenue = $500,000 ÷ $2,000,000 = 0.25 or 25%
CROA = $500,000 ÷ $5,000,000 = 0.10 or 10%
CROE = $500,000 ÷ $3,000,000 = 0.167 or 16.7%
CFPS = $500,000 ÷ 100,000 = $5.00 per share
Step 3: Interpret Results
- Strong cash-to-income ratio (1.25) indicates high earnings quality
- Healthy cash flow margin (25%) suggests efficient operations
- Solid asset and equity returns demonstrate effective resource utilization
- Strong cash flow per share provides good foundation for dividends
VII. Industry Benchmarking and Analysis
Sector Variations: Cash flow ratios vary significantly across industries:
- Technology: Typically higher cash flow margins due to scalable business models
- Retail: Lower margins but faster inventory turnover
- Manufacturing: Moderate ratios with significant capital requirements
- Utilities: Stable but lower ratios due to regulated nature
Trend Analysis: Analyze ratios over multiple periods to identify:
- Improving or deteriorating cash generation
- Seasonal patterns and cyclical trends
- Impact of strategic initiatives on cash flow
VIII. Red Flags and Warning Signs
Watch for these concerning patterns:
- Declining Cash-to-Income Ratios: May indicate earnings quality issues
- Negative Free Cash Flows: Could signal financial distress or heavy investment periods
- Volatile Cash Flow Patterns: May indicate unstable business operations
- Deteriorating Asset Returns: Suggests declining operational efficiency
IX. Integration with Investment Analysis
Valuation Applications:
- Use FCFF for enterprise valuation in DCF models
- Apply FCFE for equity valuation approaches
- Compare CFPS with market price for valuation insights
Credit Analysis:
- Assess debt service capability using cash flow ratios
- Evaluate financial flexibility and liquidity position
- Monitor trends for early warning signs
Investment Decision Framework:
- Calculate all relevant cash flow ratios
- Compare with industry benchmarks
- Analyze historical trends
- Assess sustainability of cash generation
- Make informed investment decisions
X. Conclusion
Cash flow ratios provide invaluable insights into a company’s financial health, operational efficiency, and value creation potential. By mastering these metrics—from free cash flow calculations to performance ratios—investors and analysts can make more informed decisions and better assess investment opportunities.
Regular monitoring of these ratios, combined with industry benchmarking and trend analysis, creates a comprehensive framework for financial analysis. Remember that cash flow ratios should be used in conjunction with other financial metrics for a complete picture of company performance.
Utilize our online calculators to streamline your analysis process and ensure accurate calculations. With practice and consistent application, these cash flow ratios will become powerful tools in your financial analysis toolkit.
Key Takeaways:
- Cash flow ratios provide more reliable insights than earnings-based metrics
- FCFF and FCFE are crucial for valuation and investment analysis
- Performance ratios help assess operational efficiency and management effectiveness
- Industry context and trend analysis are essential for proper interpretation
- Regular monitoring enables early identification of financial issues and opportunities